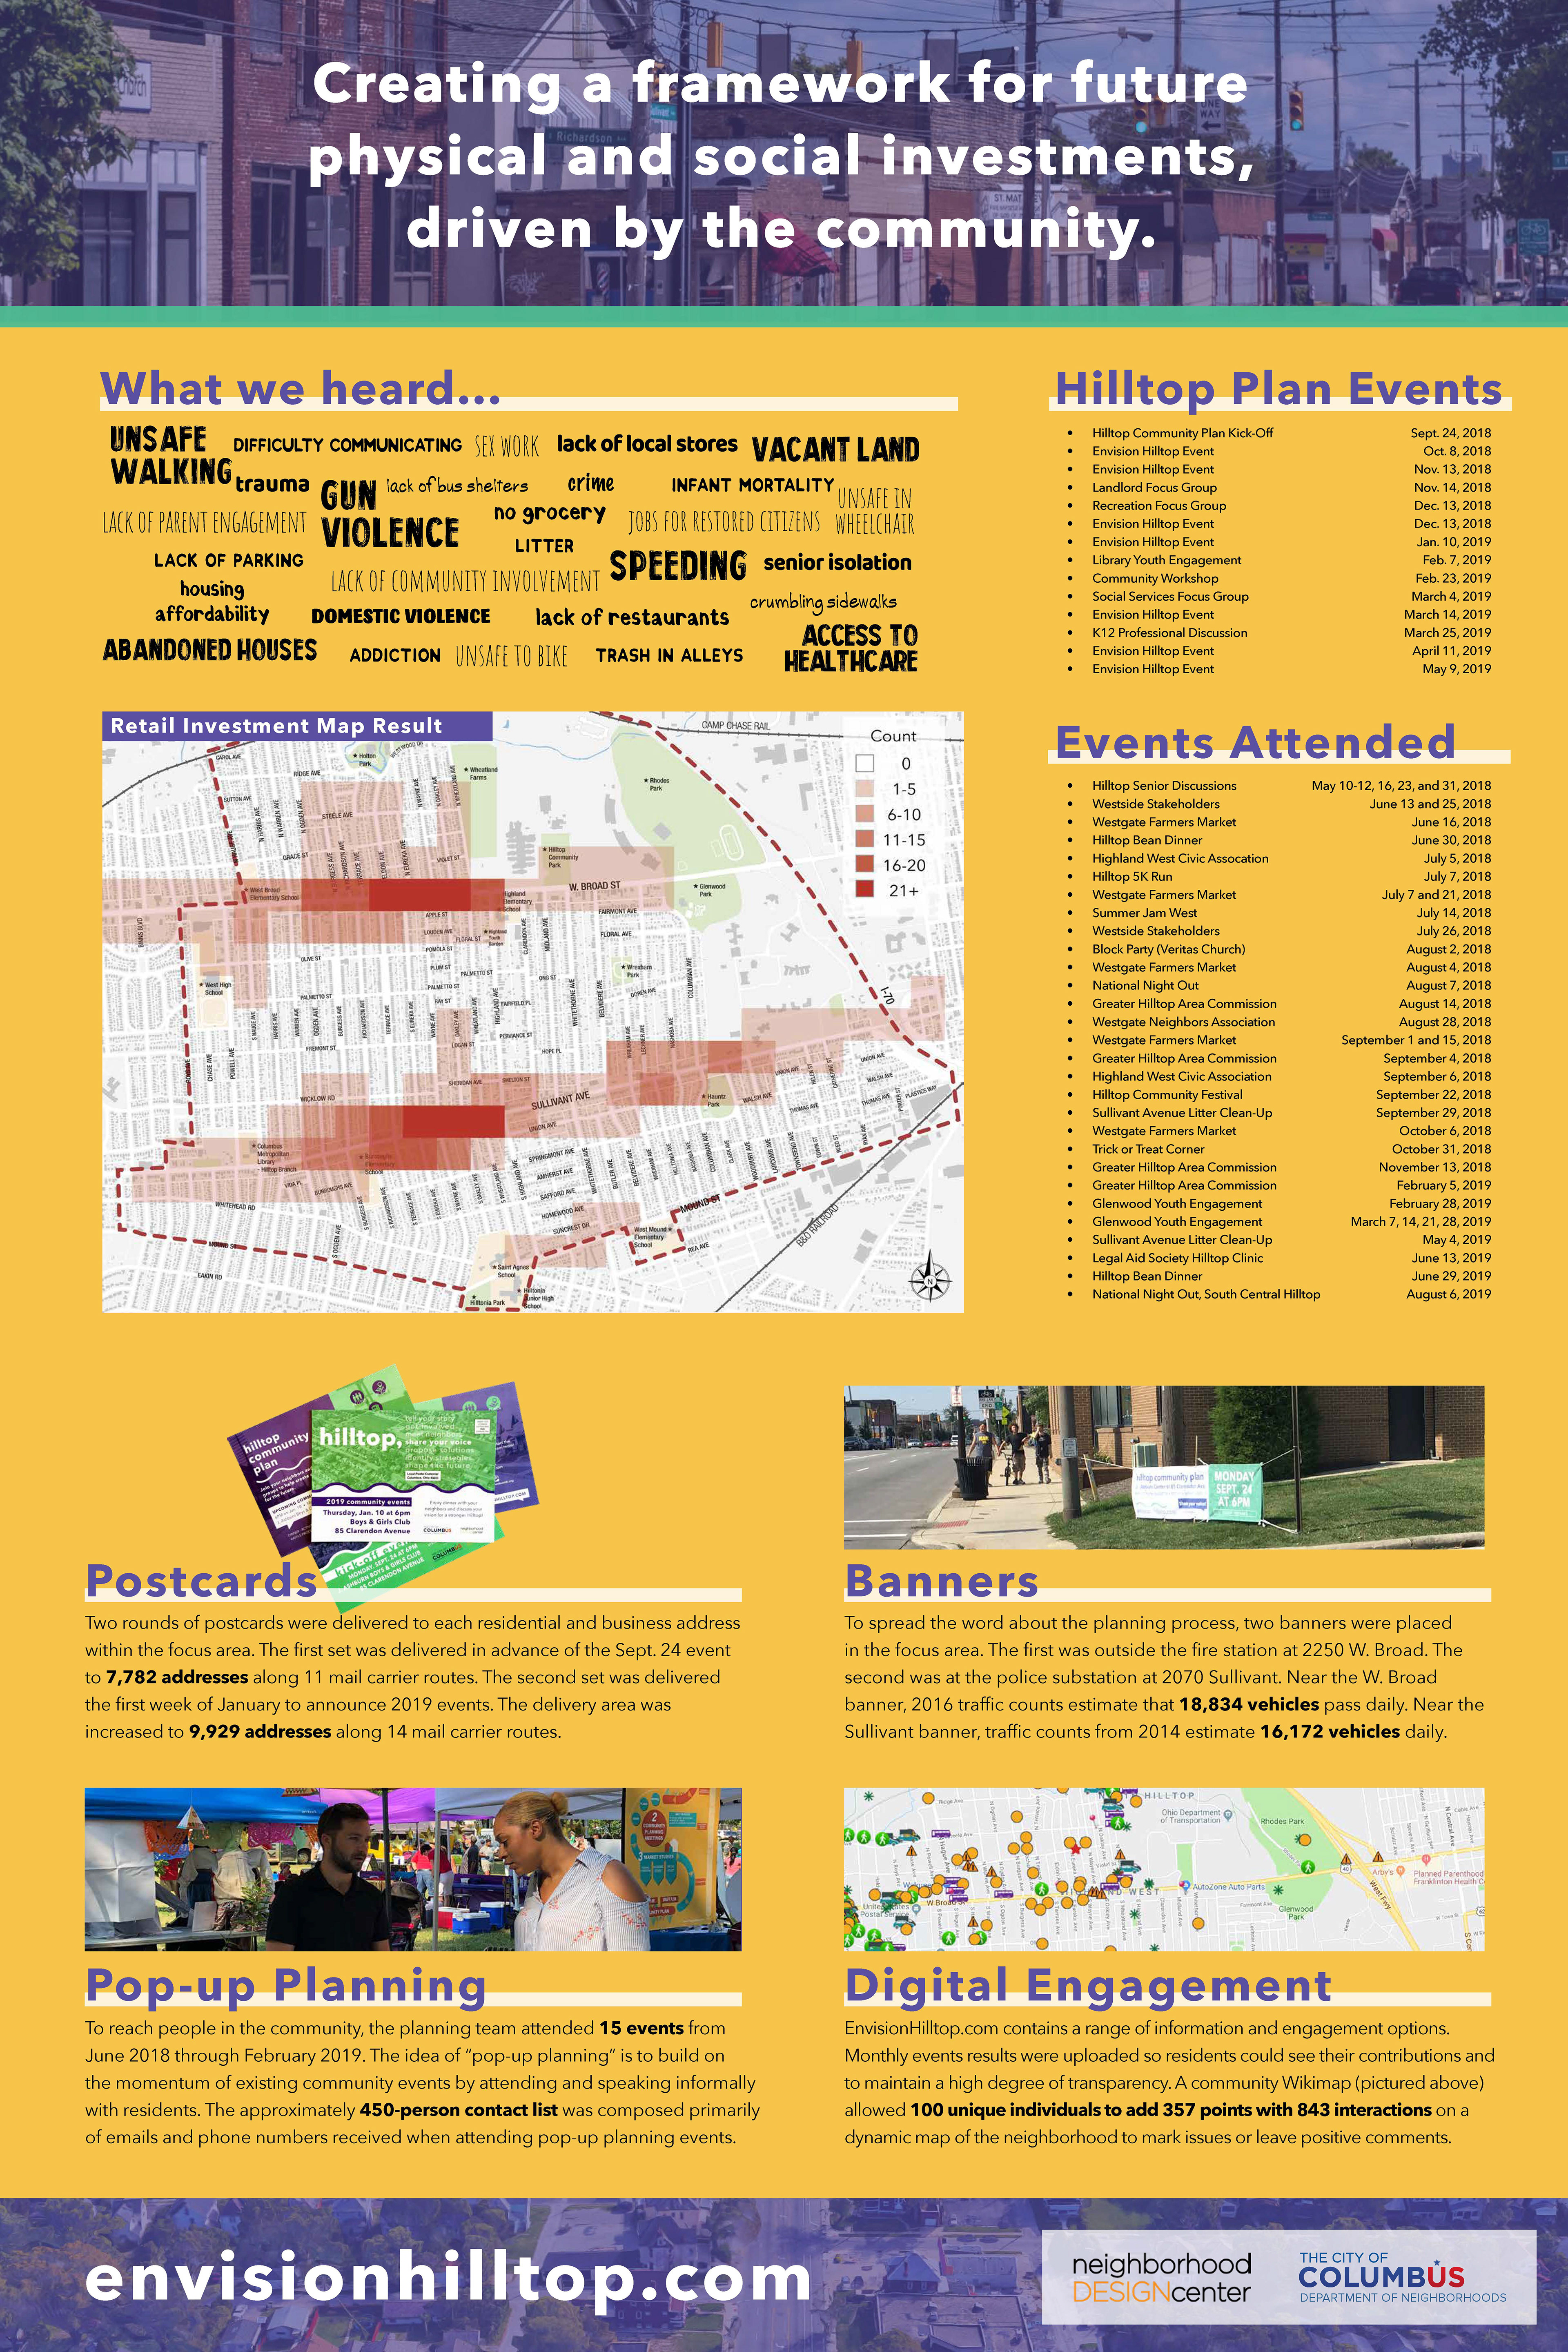

EVENTS


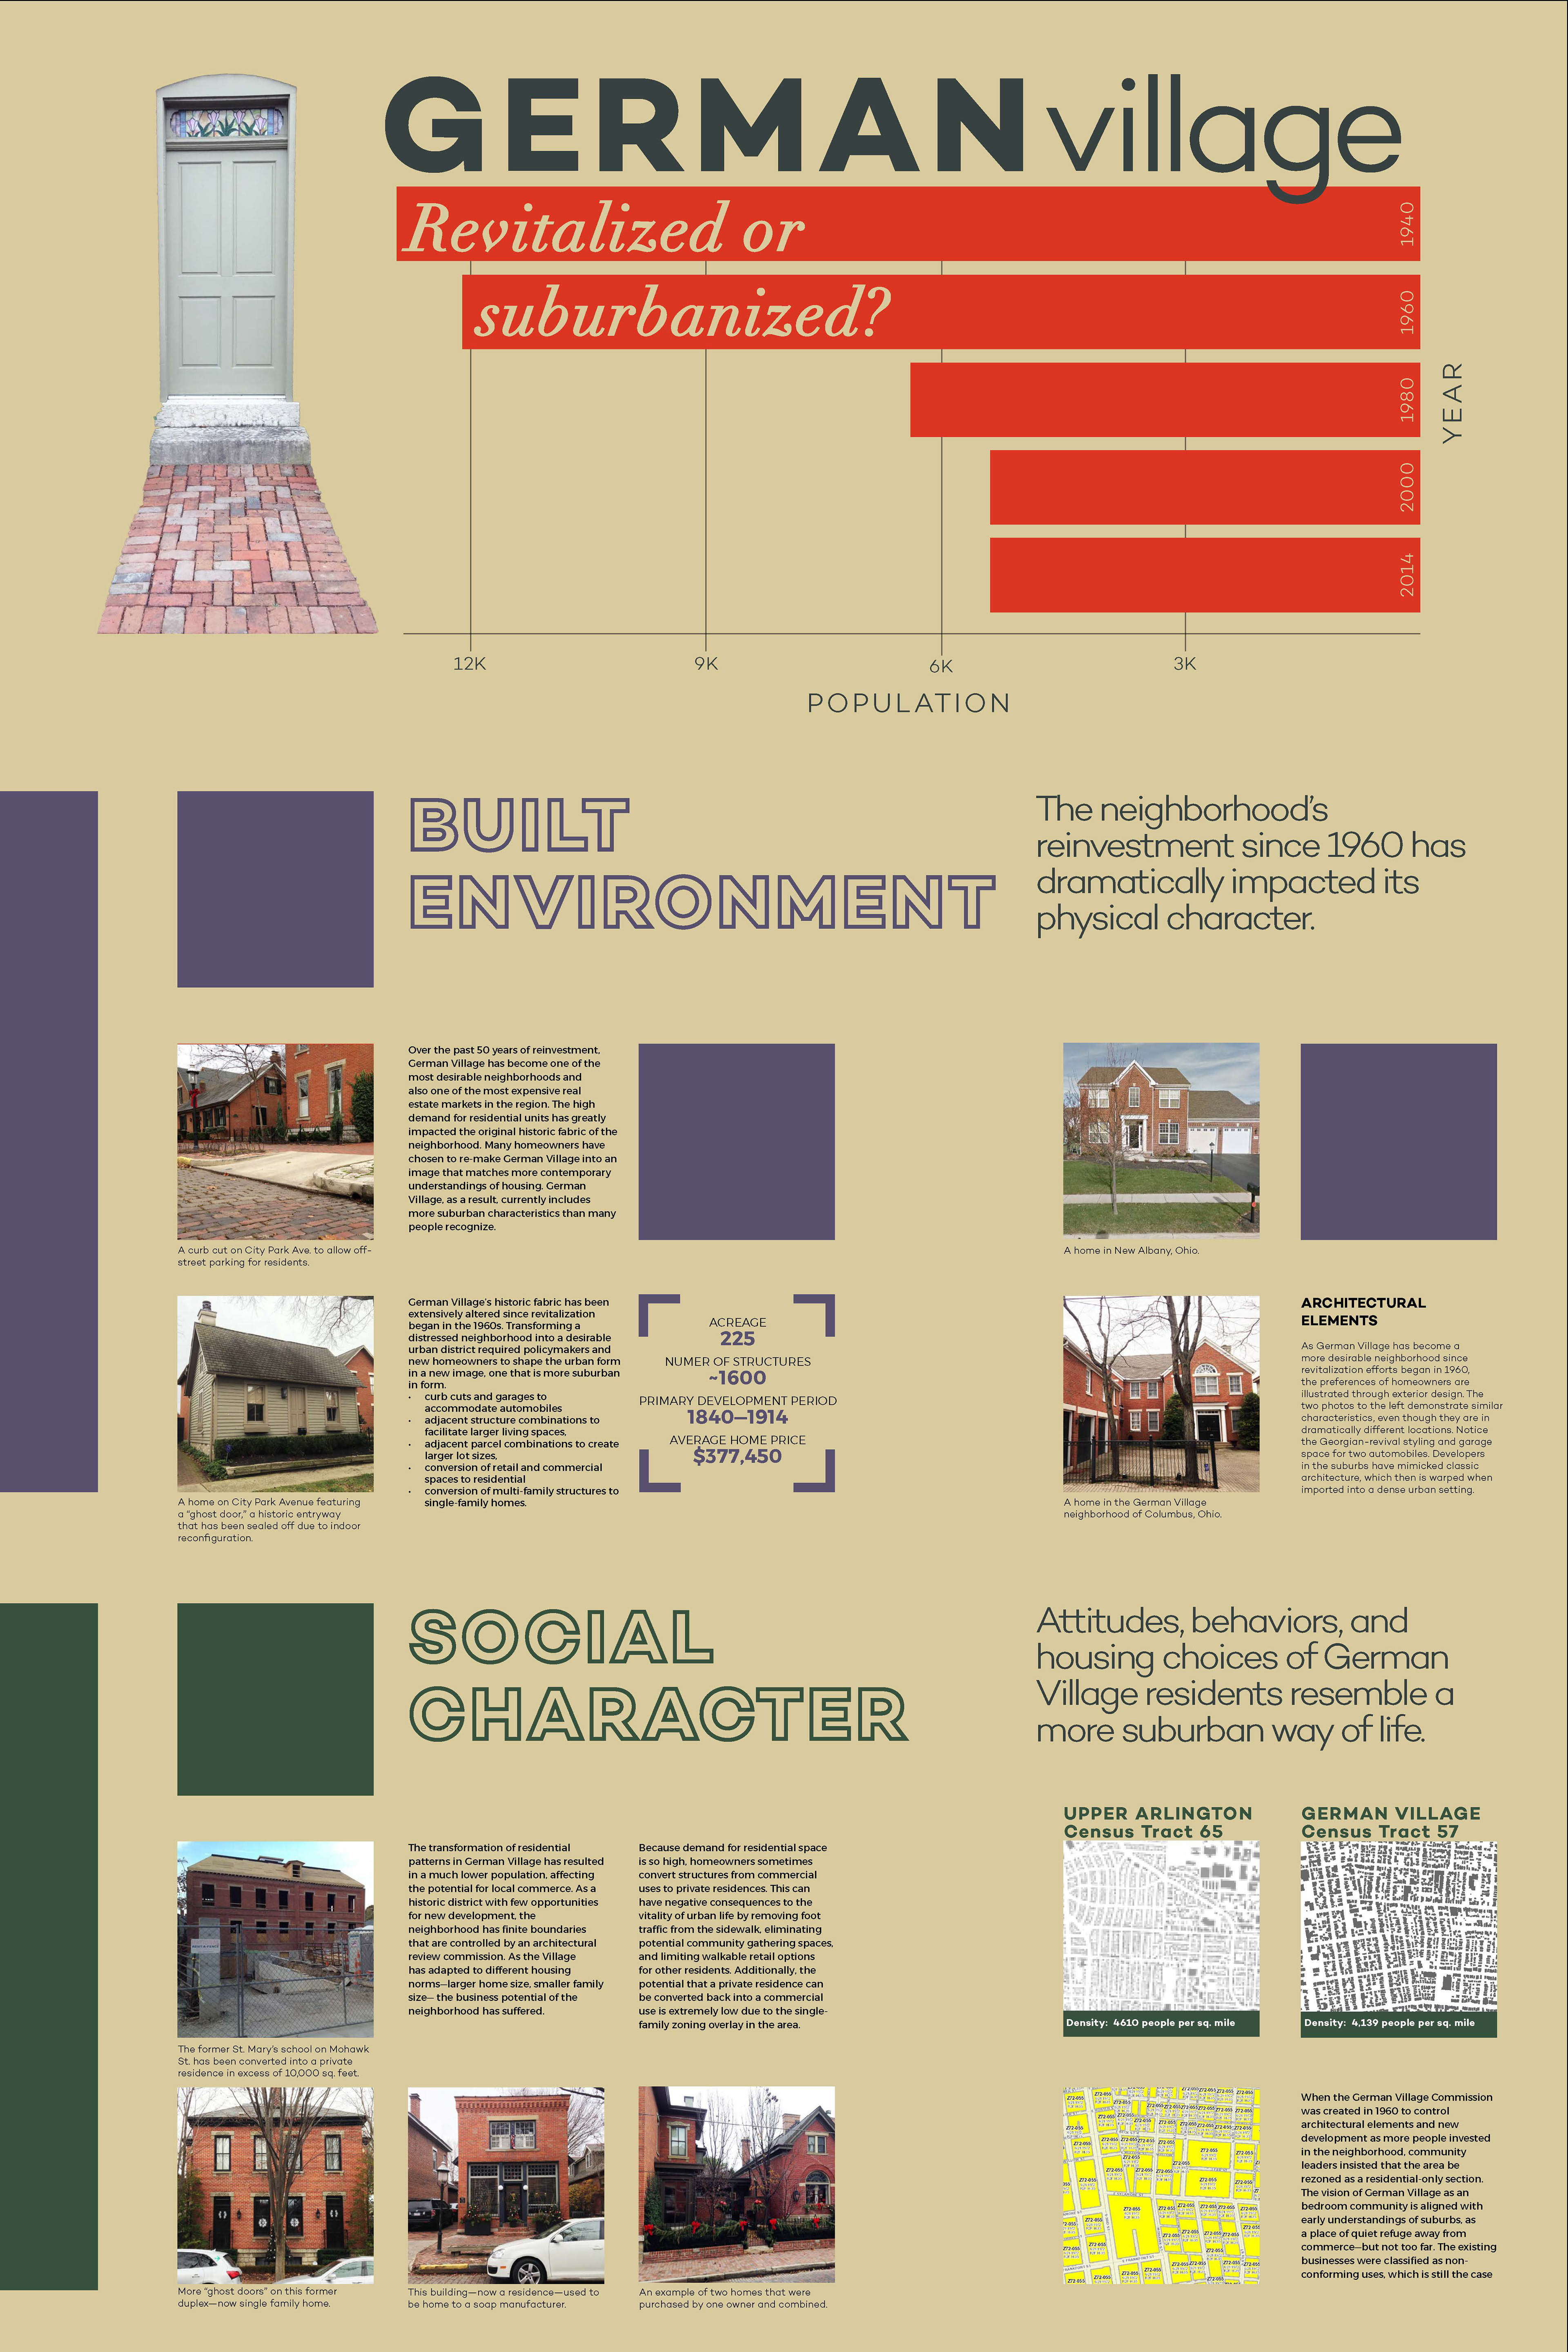
Bringing a complex research topic into understandable terms through visual separation, proximal placement, color indicators, and consistent grid adherence across the piece. Notice the use of a bar chart to anchor the header visually while providing a critical data point.
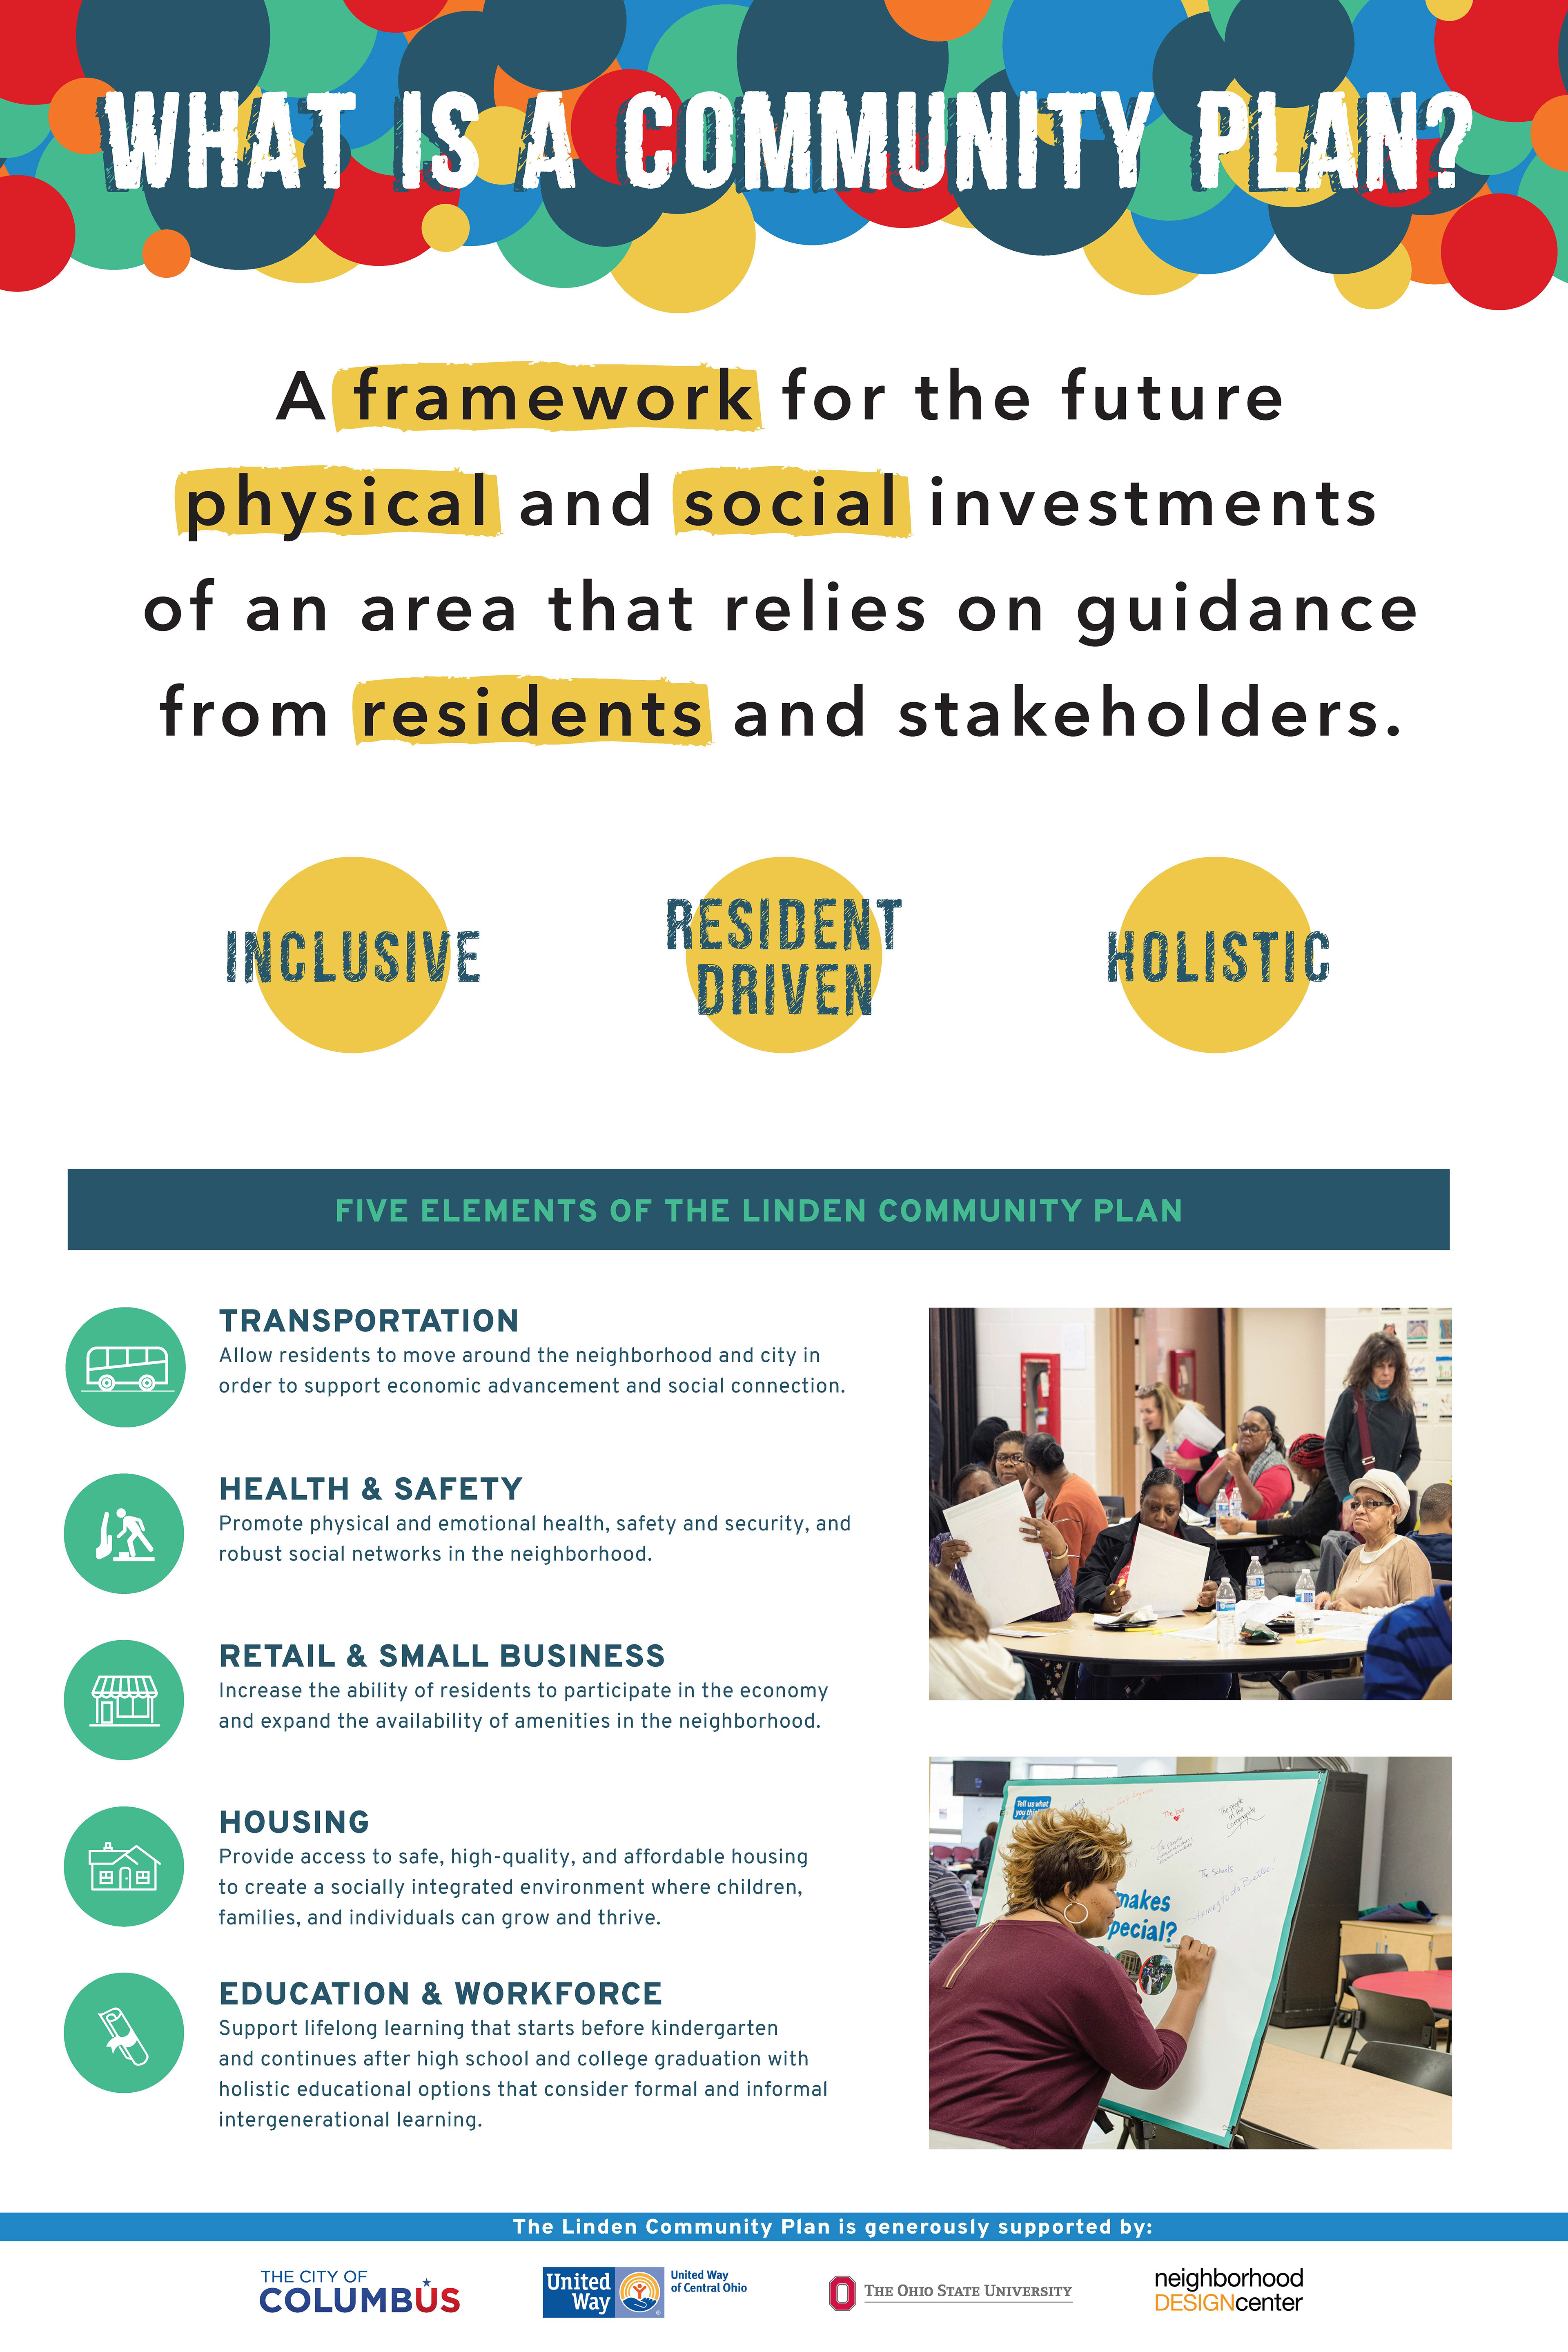
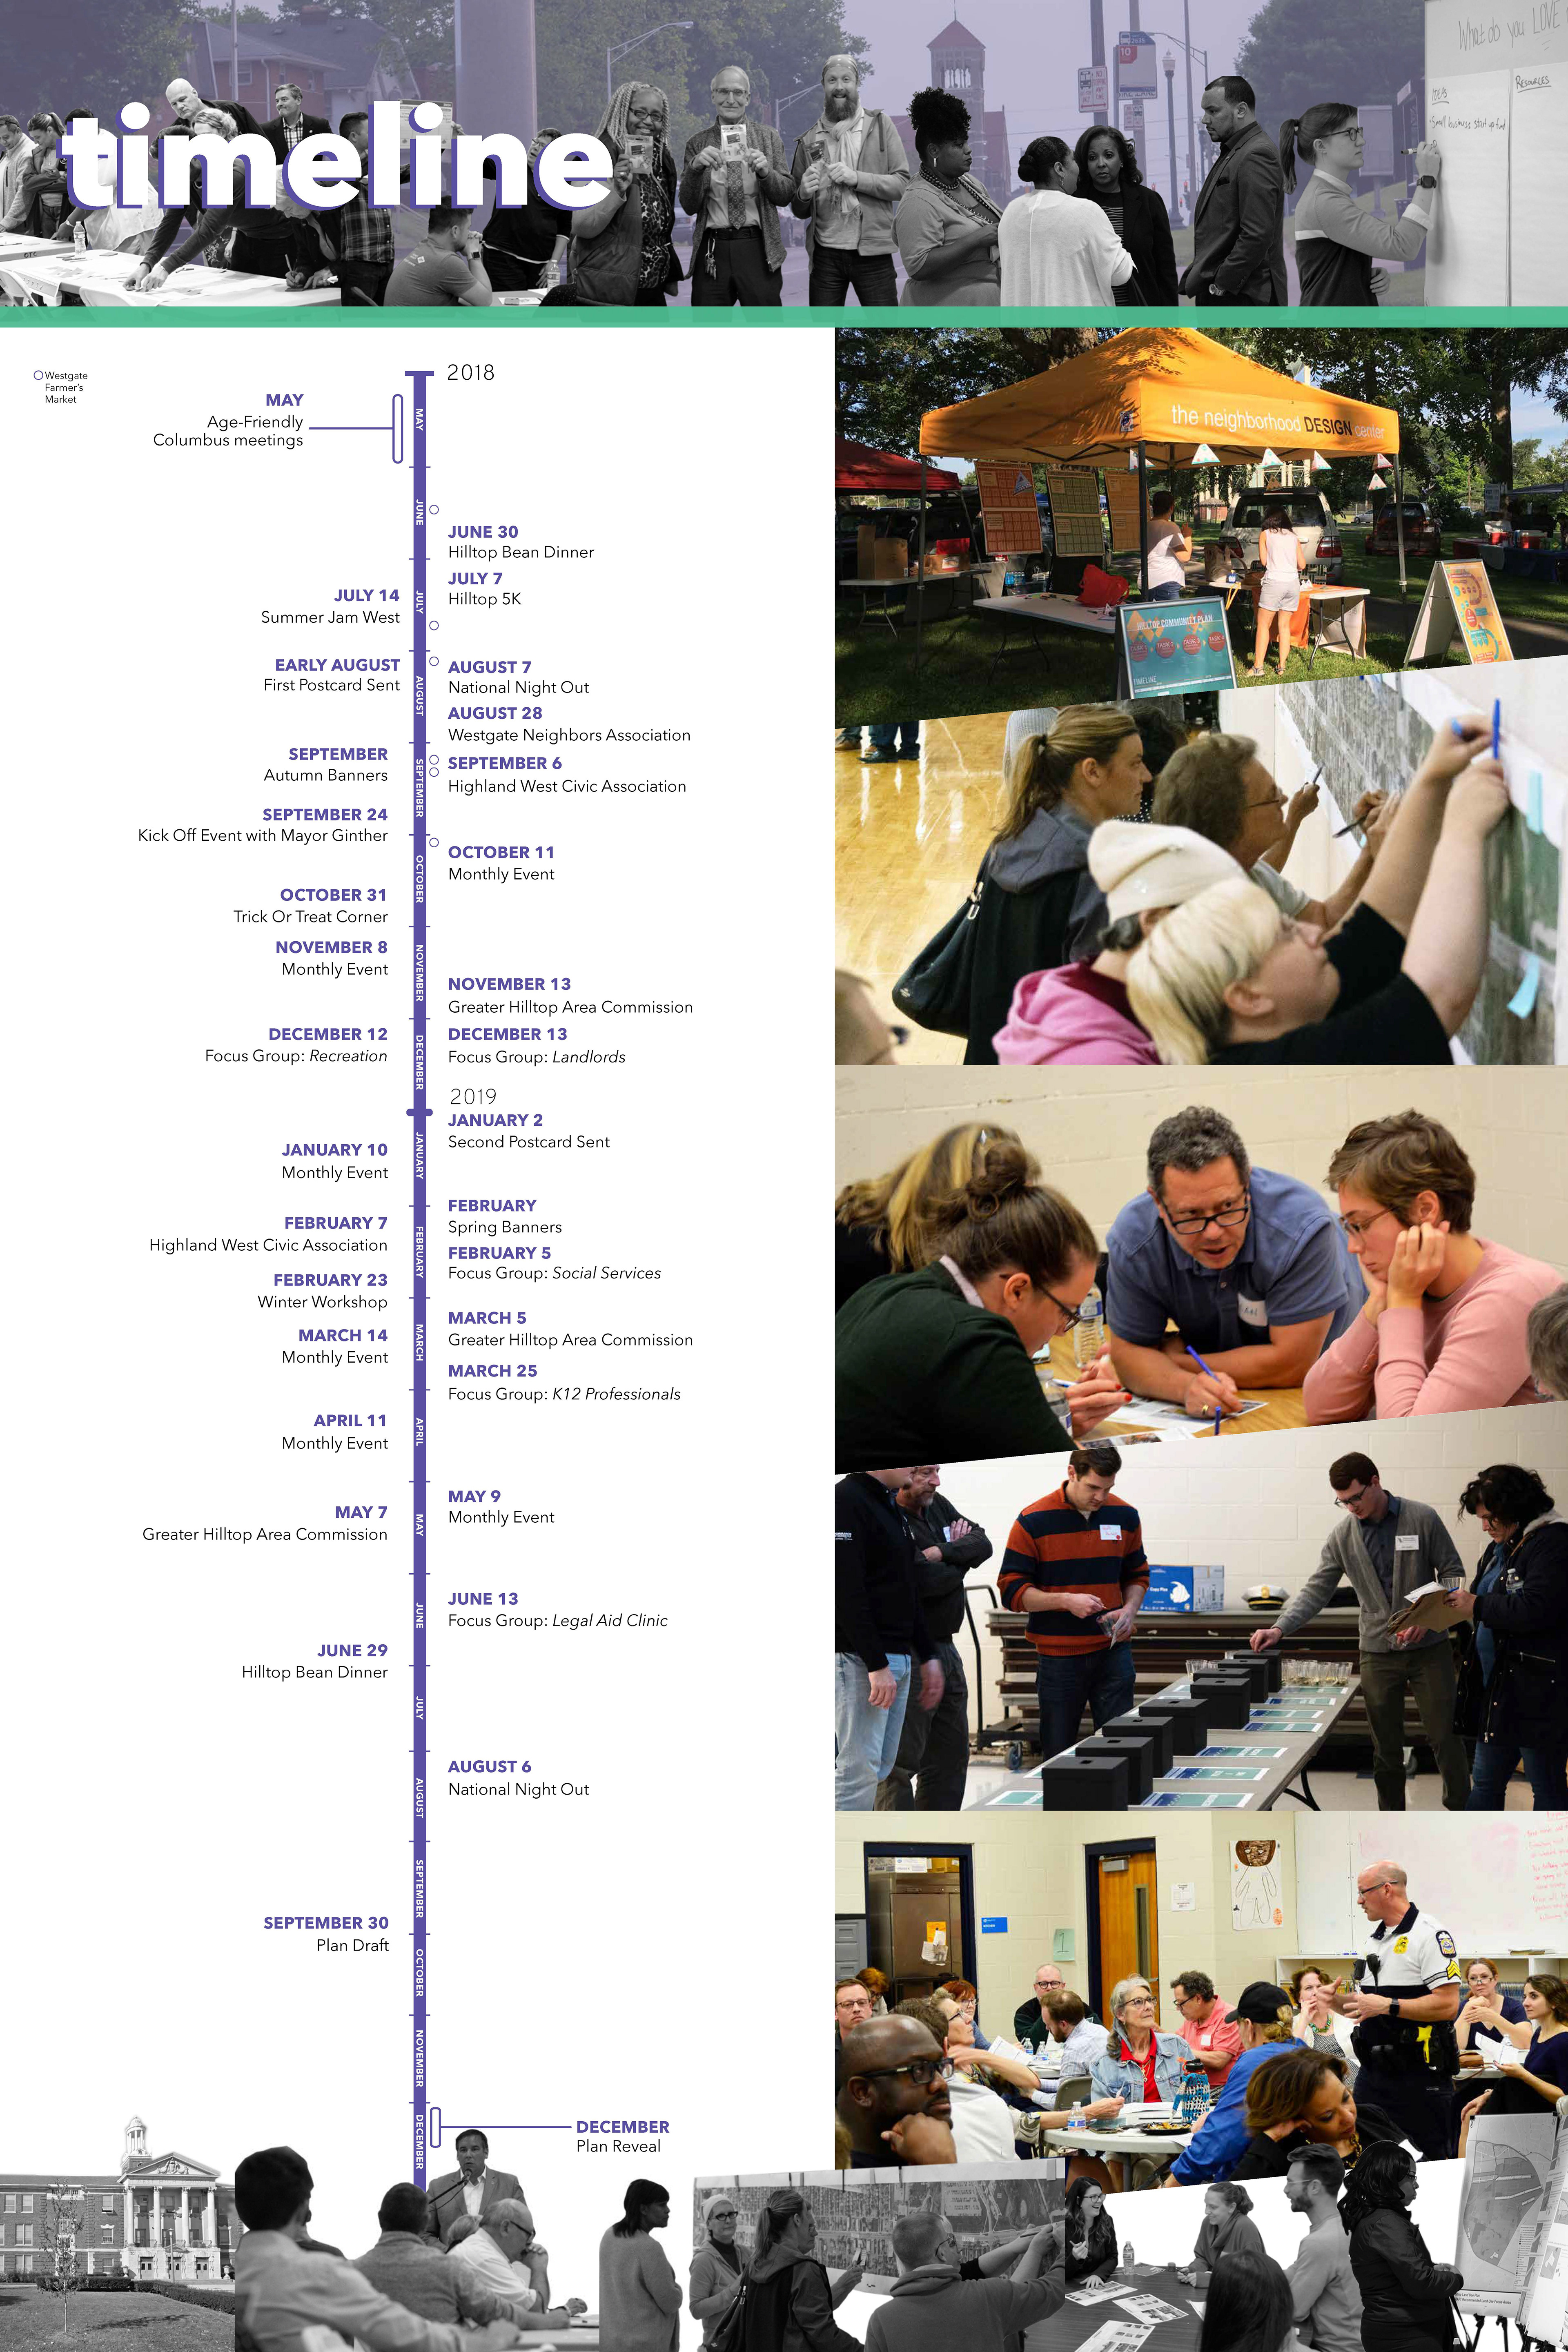
Below: One poster in a series to communicate the 18-month process of the Linden Community Plan (OneLinden)